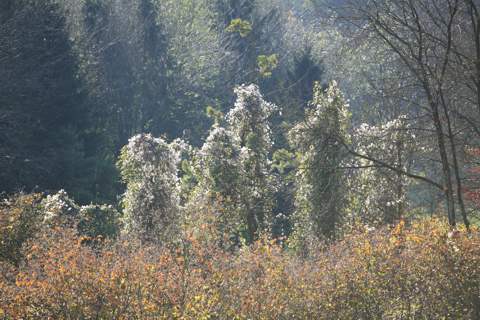
Here is a photograph. Do you think it is over-exposed?
Well, we've just taken this photograph so let's look at the in-camera histogram. That should tell us, shouldn't it? After all, that's the whole point of an in-camera histogram is it not?
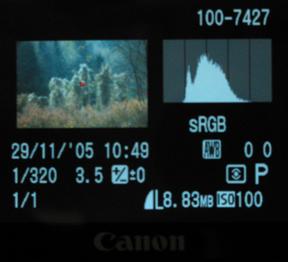 Well, the answer is quite clear: this is a rather low-contrast subject which is slap bang in the middle of the camera's dynamic range. No part of the picture is flashing. There should be no problem either with the highlights being blown out or the shadows being under-exposed. We can breathe a sigh of relief and go on to the next shot.
Suppose we shot this in JPG only. We are a simple-minded amateur user so we will process the files using Canon's ZoomBrowser EX 5.5. This is the histogram ZoomBrowser will show us:-
No sign of any over or under exposure there. In fact, it looks exactly like the camera's own histogram except that someone has sat on it.
Hmm. Suppose we are a bit more sophisticated. We could use Canon's Digital Photo Professional software (version 2.0.1.4) instead of ZoomBrowser. Then we would get this histogram:-
At least we've got a reasonable sized graph now, and we can see separate curves for red, green and blue as well as the luminance curve. None of them seem to go anywhere near the ends of the 0-to-255 range.
But, hang on a moment, if we look very carefully at the bottom left hand corner of this graph, we might just be able to see that there are, perhaps, some pixels whose value is 0. There is a hint of a vertical line there. If we get out our magnifying glass, we might see something like this:-
Yes, there are definitely some blue pixels that are zero, but who would have noticed?
And there's nothing at all at the other (255) end of the X axis, so no blown highlights:-
However, if we were to use the eyedropper tool to examine the picture itself, we would see that, in fact, the highlights really are blown out, as this 100% crop shows:-
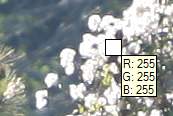
So far, Canon's software - both in the EOS 5D camera, and on the PC - has seriously misled us about the true exposure condition of this image.
Enough of this Canon nonsense. Suppose we process this JPG file in Adobe PhotoShop CS2. Would it be any better? Judge for yourself.
Not only is the histogram a different shape, clearly with a long tail running all the way to the righthand edge of the graph, but, if we hover our cursor at the righthand end, it tells us that there are no less than 219,806 pixels whose value is 255.
That's over 200,000 blown pixels that Canon either couldn't be bothered to count or to show to us! (1.7% of all the pixels in the image)
And you don't have to use Photoshop. Here is the histogram in Corel's PhotoPaint V12:-
A similarly shaped histogram, also with a clear indication of blown pixels. But PhotoPaint only finds 7052 pixels whose value is 255, even though it calculates almost the same mean and standard deviation as PhotoShop.
A possible reason for this difference is Colour Management - a wonderfully complex system for making absolutely certain that you don't really know what you are doing! When doing this experiment, I tried to turn Colour Management off, but that is easier said than done.
I am unable to explain why Corel PhotoPaint produces a notably different histogram from Adobe Photoshop. I have investigated the exact meaning of Photoshop's histograms here, but I have not been able to find a calculation that reproduces what PhotoPaint plots.
Come on, Canon, you can do better than this!
How about a custom function in the camera to say "calculate the histogram from all the pixels; I don't care if it takes you longer"?
Apart from the fact that Canon hasn't counted the pixels correctly, the other main problem is that small peaks in the histogram get driven down to an invisible height if there are also large peaks in the same histogram. PhotoPaint attempts to solve this by having a user-adjustable "clipping level" that controls how much of the histogram is allowed to disappear off the top of the graph. Canon just ignores this problem.
The most obvious solution to a scientist or mathematician is to plot the Y axis of the histogram on a logarithmic rather than a linear scale. That would guarantee that one could see all the peaks, however small they might be. Of course, it would also change the overall shape of the histogram - but would that matter?
Perhaps you are thinking "why is he getting so worked up about histograms? Why doesn't he expose the picture properly in the first place? After all, we don't have histograms on film cameras, and people manage ok." I address this here.
For more on the Canon 5D's in-camera histograms, see here.
Peter Facey, Winchester, England
20070925 updated to remove references to LCD size
20060711 edited
20051201