
I explain here that the Canon EOS 5D will not correctly show over-exposed highlights on its in-camera histogram if those highlights are dispersed in small areas across the picture. The reason for this is that the Canon 5D does not calculate its exposure histogram from all the pixels in the image. On the contrary, it calculates its histogram from a heavily downsized version of the image.
Of course, this is a very serious deficiency which is bound to result in some histograms being considerably wrong, and therefore misleading to the photographer who is relying upon them to assess whether the exposure is set as desired.
I have pointed this out to Canon staff in the UK and they don't believe me. This article explains a test I devised to prove that the 5D calculates its histograms from a heavily downsized version of the image. It also contains a test file that you could use to see if your camera has the same deficiency.
The basic idea is to print a test image on a good quality colour printer, photograph it using the camera to be tested, observe what exposure histogram the camera shows, load the resulting JPG file into Photoshop (or other suitable image processing software), and see what the true histogram of the JPG file is. If the one shown by the camera differs substantially from that shown by Photoshop, you know your camera has this problem.
In addition, by using Photoshop to downsize the JPG file, and observing how Photoshop's histogram changes, you can satisfy yourself that the reason your camera's histogram is wrong is that it is calculating it from a massively downsized image rather than the full one.
I created the test image using a C program. It looks like this:
If you look at it more closely you will find it consists of thousands of square blocks of colour. One percent of these blocks are black (pixel value 0), one percent are white (255), and the remaining 98% are one of eight colours, randomly arranged.
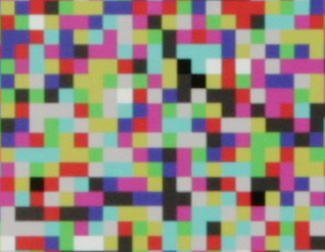
A small part of the test image looks like this:

The eight colours are formed by setting the red, green and blue channels independently and randomly to either 64 or 192. 64 is 25% along the histogram, and 192 is 75% along it; no other pixel values are used.
The important characteristic of this test image is that it has nothing in the middle of the histogram yet, if you average it, it comes to mid-grey.
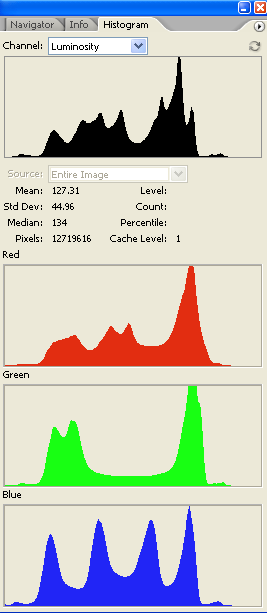
If you load this test image into Photoshop it will show the following histogram (remember to click the warning triangle with the ! in it if necessary to force Photoshop to calculate the histogram with full accuracy):
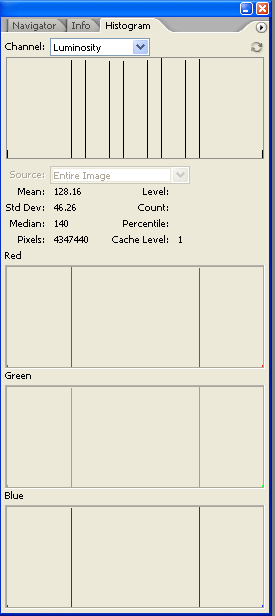
Note that the histogram for the red, green and blue channels has a spike at 64 and at 192, and much smaller spikes at 0 and at 255, and nothing else.
The top graph shows the histogram for luminosity. It happens that the eight colours used in the test image all have different luminosities, resulting in the eight spikes around the centre of the X axis. There is no luminosity at all in the centre of the histogram (at X=128).
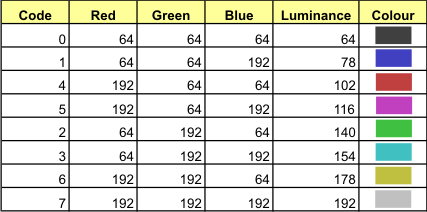
The eight colours and their luminance values are shown in the table.
We begin by printing the test image on a good quality colour printer to produce a target. Ideally print at about A3 size, but if that is not possible A4 will do. However, if you do use A4 you will probably need a macro or other close-focussing lens on your camera because we will need to fill the frame with the printed target.
The printing scale should be set so that the paper is as far as possible completely covered by the image and so that the individual blocks of colour are about 1 mm in size. On my A3+ printer, simply saying fit to page produces a satisfactory print with the blocks about 1.2 mm in size. If printing on A4, do NOT use fit to page, print the image unscaled, and let the printer clip it.
It probably doesn't matter what colour management choices you make for printing. If you have a choice, set the color management engine to use relative colorimetric conversion. The test image is in sRGB. It is important that you set the printer profile as appropriate for the kind of paper you are using. I used Epson Premium Gossy Photo paper. Set the printer in its best quality print mode.
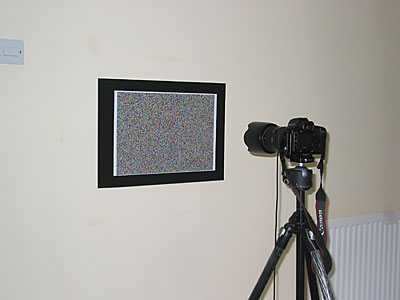
Fix the target onto some flat surface. This is necessary as the depth of field may be quite small and we want the target to be in sharp focus.
Somehow you have to obtain a fairly even illumination of the target. It's easiest to do this outdoors on an overcast day. In my case I used a couple of photofloods, one on either side of the camera, angled in at 45 degrees.
Mount the camera on a tripod and frame the target so that it completely fills the picture and you cannot see any white or other coloured border at all: you should see nothing but the little coloured blocks in your picture. Note: your viewfinder may show less than the full picture, so take a test shot and examine the image on the LCD to see that the framing is tight enough.
An aperture of f11 will maximise the depth of field whilst avoiding diffraction effects; if your camera has a crop factor of 1.4 or higher, perhaps f8 might be preferable. (For a good tutorial on diffraction, see here.) Adjust the exposure normally, so that the target is neither over- nor under-exposed. The printed target will not be of very high contrast and will probably fit quite comfortably in the middle of the camera's dynamic range.
Set your camera to produce the highest quality JPG file. (Do not use raw as the unavoidable adjustments that happen when processing a raw file may change the histogram.)
Take the test shot using mirror lock up and a cable release if you can. If not, just do it gently.
Before removing the card from the camera, play back the image and observe the camera's histogram. In my case, with the Canon 5D, it looks like this:
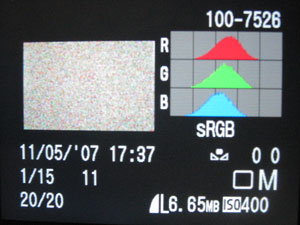
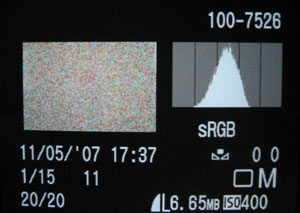
or as shown at right if the camera is set to show luminance rather than RGB:
In both cases there is a single, bell-shaped peak in the middle of the camera's dynamic range. (The fact that the blue peak is slightly to the left is probably due to my photofloods being rather yellowish, and a slightly inaccurate whitebalance. This doesn't matter.)
The important point to note is that these histograms are completely wrong when compared with the histogram that Photoshop produced for the test file (which we saw earlier here).
Before we get too excited about the big difference between the camera's histogram and the correct histogram for the test image, we need to remember that we don't live in a perfect world. We've printed this perfect test image on an imperfect real-world printer. Then we've photographed the resulting print with imperfect lighting and a less than perfect lens and camera, and taken the resulting photo in the form of a JPG file which uses lossy data compression methods. We cannot expect a perfect result!
So, rather than comparing the camera's histogram with Photoshop's ideal one, we need to compare it with the correct histogram for the JPG photo we've just taken.
To do that we need to copy the JPG photo from the camera to our computer but without deleting it from the camera, so we can still see the camera's histogram. If you use a card reader that is easy to do: just copy the file off the card onto the computer, then replace the card in your camera. If you use a USB cable to upload directly from the camera, you need to avoid clearing the image from the camera afterwards.
Then load the JPG photo into Photoshop (or a suitable image editor) and examine its histogram.
When I did this with the photo taken by the Canon 5D, the image looked as shown on the left below:
On the right I show the ideal test image for comparison. (In both cases I only show a small 100% crop from the full images.)
Certainly the real world is less than perfect! Bear in mind however, that I have not adjusted the 5D image at all. It could be adjusted to make the black black and the white white, and it could be sharpened a bit. But that would change the histogram so it wouldn't be sensible to do that now.
Here is what Photoshop reports as the histogram of this 5D image (at left), and I have reproduced the histogram from the Canon 5D's LCD display for comparison (at right):
Clearly, the 5D's histograms of this image are completely wrong.
We can see why the 5D gets the histogram wrong by asking Photoshop to downsize the image. At the moment it is 12 megapixels (or whatever size your camera produces). If you use Photoshop's IMAGE SIZE command to downsize the image to a mere 3% of its current size, Photoshop will average the pixels in each locality to create the new, smaller, image. Immediately, its histogram will change as shown below:
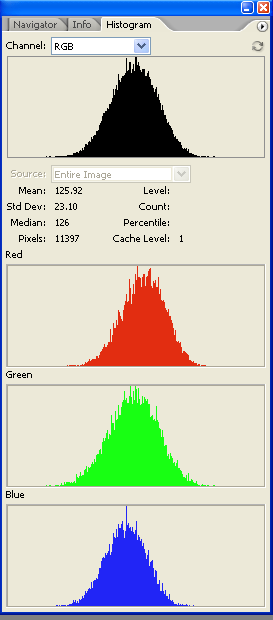
Recognise this anyone? Yep, it's a pretty good match for the histograms the 5D was showing us. And this proves that the 5D is calculating its histograms from a heavily downsized version of the image rather than by counting every pixel in the image. QED.
I summarise my findings on today's in-camera exposure histograms, and how I think they could easily be improved, here.
You may have wondered why even the correct histogram of this image differs enormously from the histogram of the original test file (the one we used to print the test target).
Here is what Photoshop reports as the histogram of the 5D image (at left), and I have reproduced the ideal histogram of the test image for comparison (at right):
The differences are simply due to all the imperfections already mentioned and, I dare say, my less than perfect technique.
Also, we have not adjusted the 5D photo to set the white and black points to the values we know they ought to be.
Remember that the target is defined in RGB but printed on a CMYK printer (in my case an Epson R2400 with eight inks), and that, even when using good quality glossy paper, we cannot reproduce on paper the contrast range of the RGB original.
There are only seven, rather than eight, peaks in the central part of the luminosity histogram. This is because the combination of printer and camera cannot reproduce the cyan and greeny-yellow blocks perfectly, and this causes these two colours to have almost the same luminosity. Hence, the 6th and 7th peaks (counting from the left) are merged.
The lefthand peak in the red is smeared out, and the blue has grown two peaks in the middle that shouldn't be there. These may well be caused by the interpolation that is done by the camera when demosaicing its Bayer sensor array. There are twice as many green pixels in a Bayer array than red or blue ones, and the green channel here does seem to be closer to the ideal.
I mention all this just so you don't get upset if your camera cannot perfectly reproduce the test target.
I'd really like to know if this problem with histogram calculation applies only to the Canon 5D, or whether, as I suspect, it applies to all contemporary digital SLRs, even the top of the range professional ones. You could help by trying this test yourself with your camera and letting me know the result. (My email address is at the bottom of this page. If you cannot see it, please enable Javascript and refresh the page.)
Here is the test image file. It's a TIFF file with LZW compression, and I give it in two forms, one for the PC and one for the Macintosh.
| For the PC (651 KB) | Right click |
| For the Mac (651 KB) | Right click |
Peter Facey, Winchester, England
20070925 updated to remove references to LCD size
20070622 edited
20070512