Mike Collins (whom I met on dpreview - see his profile) analysed the 5D raw files I put up here by converting them into TIFF using Adobe Camera Raw (ACR) and then putting the TIFF into Imatest.
Mike used parameters in ACR that he had previously found were good for extracting the best dynamic range from his Canon 1D mkII. In particular, he found that if one overexposed in the camera by one to two stops, highlight detail that would be blown out on the JPG file could be recovered from the raw file by this way of processing.
Specifically, the ACR settings he used were:-
Converting the RAW to TIFF using these settings and feeding the TIFF into Imatest then gave the following result:-
| Raw files | Dynamic Range in f-stops | ||||
|---|---|---|---|---|---|
| Gamma | Low quality | Medium quality | Medium-High quality | High quality | |
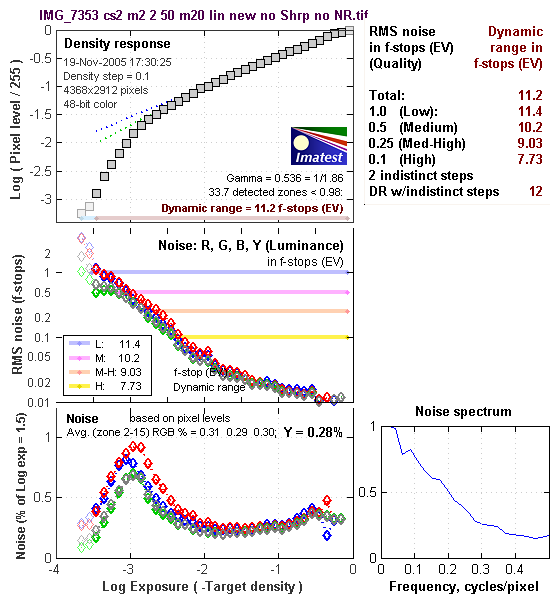
| 5D | 0.54 | 11.4 | 10.2 | 9.03 | 7.73 |
| 1D mkII | 0.54 | 11.1 | 9.9 | 8.94 | 7.64 |
So this method gained nearly 1.5 stops on the "low quality" or useable dynamic range figure, and 0.8 stops on the "high quality" one. Notice that the linear curve produces a lower gamma.
I also show above Mike's result for the Canon EOS 1D mkII. The raw file for that test was not shot by me so the conditions may not be comparable. The tentative conclusion I would draw from the above two results is that there is no reason to think the 5D dynamic range is worse than that of the 1D mkII when processed sensibly from raw.
Mike's Imatest "figure 2" output graph is shown below. I think it was produced using Imatest version 1.4.13. For further explanation of these figures, please see the Imatest website and look for step chart.
You will see that the "low quality DR" figure is bigger than the "total DR" figure - an apparent impossibility. Norman Koren has since changed the way the "total DR" is calculated, so that all the DR figures take into account the so called "indistinct zones". The high variability of the "total DR" figures that I have observed over many different tests has caused me to ignore the number of "detected zones" and the consequent "total DR" figures, and to place more emphasis upon the "low quality DR" figure, which is much more stable.
Using Imatest version 1.5.6 I have not been able to reproduce exactly Mike Collins' result. But I can get very close to it if I use his settings except for adding a little "Colour noise reduction" - about 15, and white balance "as shot".
Figure 2
Peter Facey, Winchester, England
20051230