The target was a white board lit uniformly. The EF 70-200mm f/2.8L IS lens was used at 200mm and a distance of 1.5m but focussed at infinity; hence the target was heavily defocused in order to obscure any non-uniformities of the board. The camera was set on manual exposure at f/9. This aperture was chosen because a larger one tends to spread out the signal across the camera's histogram.
The shutter speed was varied over a range from 1.6 seconds to 1/5000 of a second so as to cover the full range of exposures from off the lefthand end of the camera's histogram to off the righthand end.
Two shots were taken at each exposure setting. The first shot of each pair gave the mean value of the signal. The two shots were then subtracted and the standard deviation of the difference calculated. The noise is that figure divided by the square root of 2. These calculations were done on a 200 x 200 pixel crop from the centre of the images.
The purpose of the subtraction is to remove, as far as practicable, variations in the signal due to non-uniformity of the target or its lighting, spatial non-uniformity of the sensor response, or dust on the sensor. All of these would be the same for the two shots and are therefore removed upon subtraction.
The camera wrote 12-bit raw files and all in-camera noise reduction options were turned off. The raw files were processed in such a way as to extract the numbers (referred to as DN for data number) without any alteration. The raw file was split into its red, green and blue components, but no Bayer interpolation (or 'demosaicing') was done.
The statistics of the green component before subtraction are shown in the table here.
The table below shows statistics of a 200 x 200 pixel area in the centre of each image for the green component after the two frames have been subtracted.
The top six exposures are clipped by firmware, and this is the reason why their standard deviation is zero.
The bottom three exposures essentially show nothing but read noise.
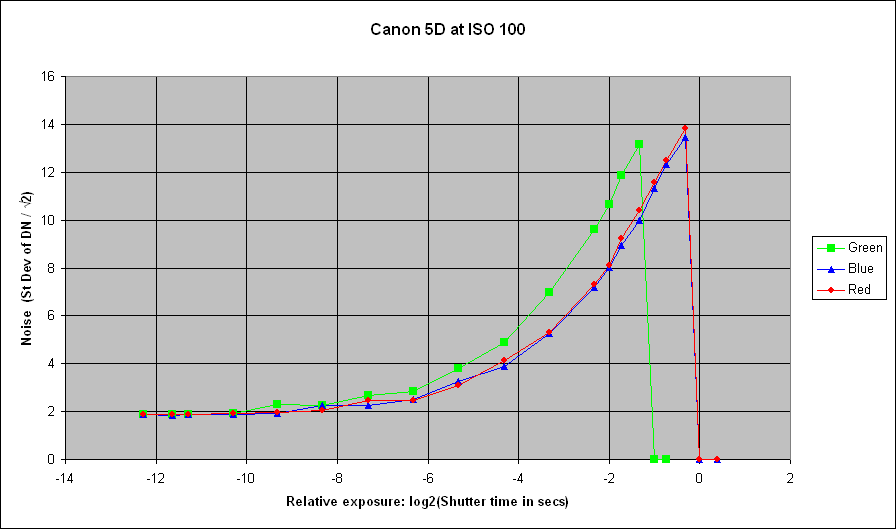
The figures for measured noise (including read noise) are plotted below:
The signal to noise ratio (including read noise) is plotted below on logarithmic scales:
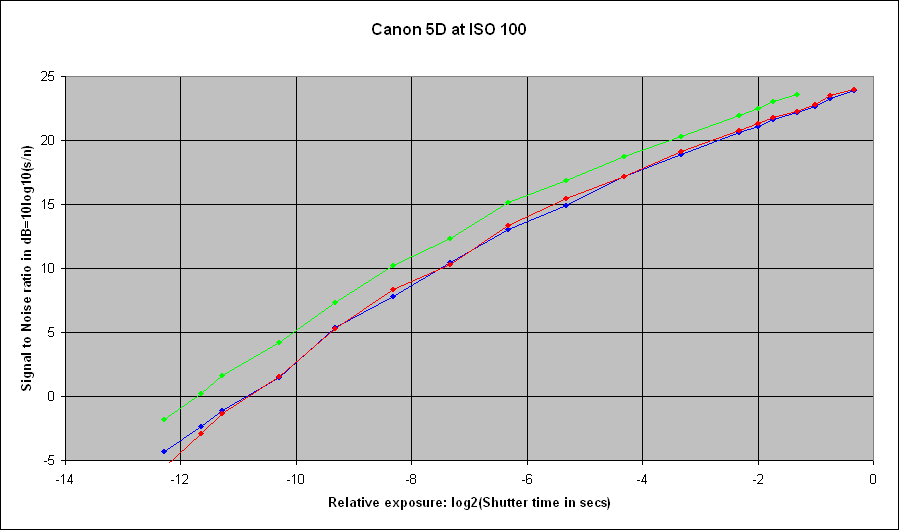
Please note that the vertical decibel scale is 10*log10() and not the 20*log10() used in the audio industry.
One can read a useable dynamic range for the camera off the above graph:
By adopting 3dB as the lower bound, rather than the read noise, we are requiring the signal to be at least twice the noise in the shadows. I consider that
to be more reasonable from a photographic point of view.
Peter Facey, Winchester, England
20080130 originated