See here.
The statistics of the green component before subtraction are shown in the table here.
The table below shows statistics of a 200 x 200 pixel area in the centre of each image for the green component after the two frames have been subtracted.
The top three exposures are at or close to saturation, and this is the reason why their standard deviation is lower.
These figures are plotted below:
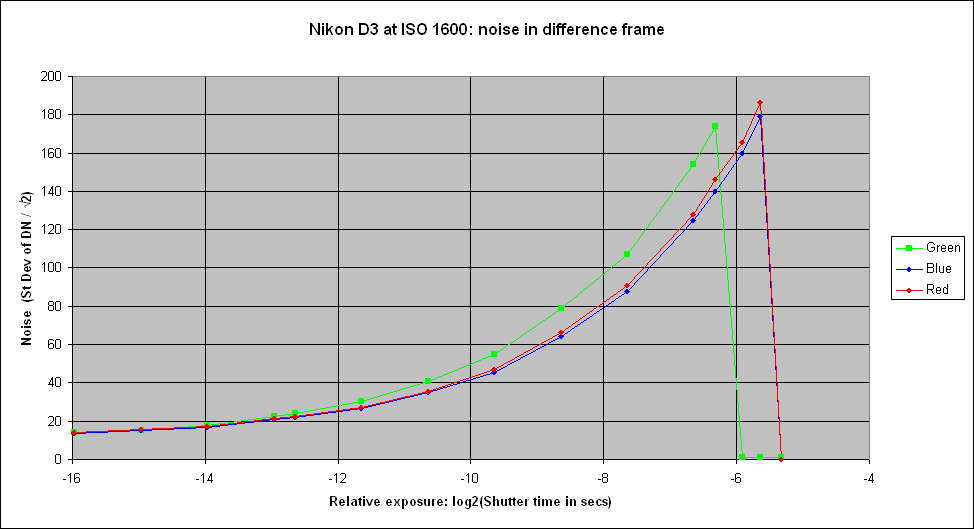
The curve at the left end is asymptotic to about 13.9 which could be seen as one possible estimate of the read noise, given the impossibility of measuring it from dark frames. However, it would be an underestimate due to the clipping at zero.
The signal to noise ratio (as measured including read noise) is plotted below on logarithmic scales:
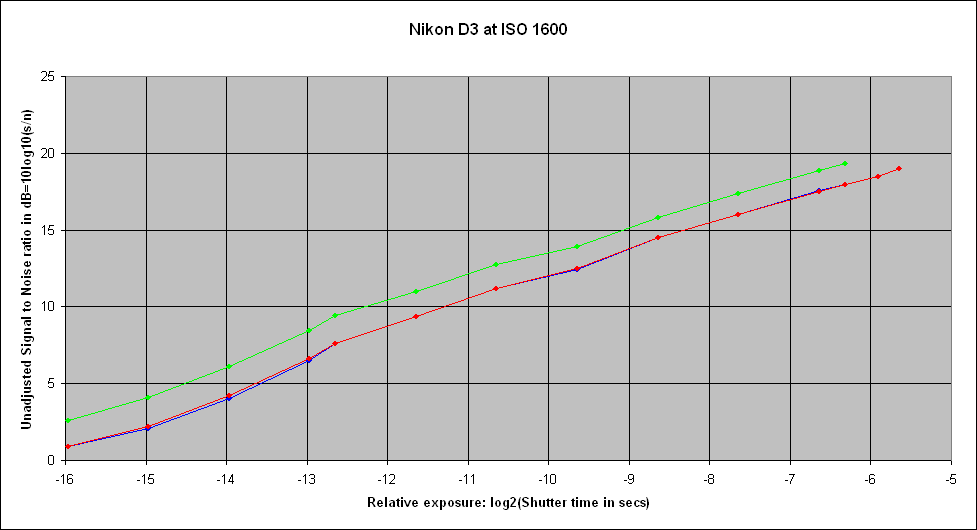
Please note that the vertical decibel scale is 10*log10() and not the 20*log10() used in the audio industry.
One can read a useable dynamic range for the camera at ISO 1600 off the above graph:
By adopting 3dB as the lower bound, rather than the read noise, we are requiring the signal to be at least twice the noise in the shadows. I consider that
to be more reasonable from a photographic point of view.
Peter Facey, Winchester, England
20080131 originated