Because with the D3 there is no voltage offset applied to the input of the analogue-to-digital converter (ADC), the output of the ADC when the sensor is in the dark is zero. Consequently, the noise near zero exposure is clipped and it isn't possible to measure the read noise by the usual procedure of subtracting two dark frames and examining the standard deviation of the result.
In fact, in a dark frame measured at ISO 200, 74% of the pixels had value zero, so it wasn't even possible to calculate the noise by assuming that the distribution observed was a half Gaussian.Pairs of heavily under exposed shots were taken, 1/3rd of a stop apart in shutter speed, in order to get as many points as possible having mean DN below 100. The mean signal, S (in DN), was calculated from one shot of each pair, and the noise, N (in DN), by taking the standard deviation of the difference frame and dividing by the square root of 2.
N² = (1/g)*S + E², where E is the read noise in DN and g is the gain in electrons per DN.
A graph of measured noise squared against mean DN should therefore be a straight line with gradient 1/g and intercept giving the square of the read noise in DN.
The table below shows statistics of a 200 x 200 pixel area in the centre of each image for the green component, at ISO 200. The figures for the individual shots are given at left, and for the difference frame at right.
These figures are plotted below, for DN values below 200:
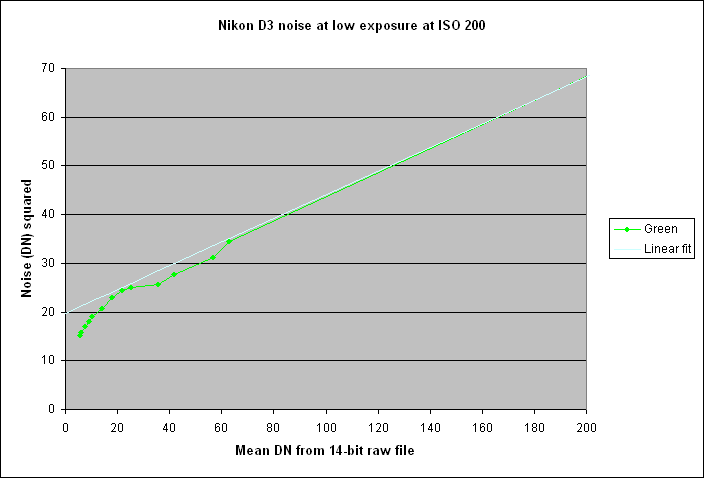
The white line shows a linear fit to the green curve for the 13 righthand points for which Min>0 and therefore it is assumed that no clipping was occurring. The equation is: N² = 0.2424 * DN + 19.768 and R² was 0.9999
To provide sufficient points for this graph, I have combined measurements taken specifically for read noise (as described above) with some taken earlier at higher exposures for the S/N analysis. They seem to join seamlessly.
The read noise is therefore squareroot(19.768) = 4.45 DN, at ISO 200. This compares with a figure of 4.64 DN at ISO 400 measured by Christian Buil here.
The value of g from this line is 1/0.2424 = 4.125 electrons/DN, essentially the same as that obtained here.
It can be seen that the green diverges from the linear regression below DN=60, suggesting that the five points corresponding to shutter speeds 1/1600 to 1/640 sec are also affected by clipping, even though these points have Min>0.
This method of measuring the read noise is not as accurate as one would like. I also tried photographing a Kodak Q13 step chart at low exposure, but that did not produce enough good points. If attemtping to use a chart, it would have been better to use an IT8 chart, as Emil Martinec did here, because the IT8 has smaller density steps in its gray scale.
Peter Facey, Winchester, England
20080218 revised to use a longer series of data
20080201 originated