Photographs were taken in near total darkness with no lens fitted, with the body cap in place and with the viewfinder eyepiece shutter closed. A shutter speed of 1/1000 sec was used to minimise thermal noise.
Two shots were taken for each ISO setting. A ten second delay was imposed between shots to avoid any build up of thermal noise due to heating of the sensor or surrounding electronics.

Each image appears to be completely black, because they were shot in the dark. But if we greatly increase the contrast in the image, we will be able to see that there is some slight variation in the numbers recorded. Opposite is the image for the green wells at ISO 100. I have scaled it to 50% in height in order to restore the correct shape.
Some of the variation we are seeing here is caused by fixed imperfections in the camera - that is by imperfections that don't change from shot to shot. Such patterning is simply caused by unevenness in the sensitivity of the sensor wells.
On the other hand, some of the variation we are seeing is caused by random noise, which varies from shot to shot. Such noise is generated in the electronics as we read the charges out of the sensor wells, amplify and offset the voltages, and then digitise them in the analogue-to-digital converter (ADC). The ADC itself generates "quantisation noise" because if the true signal should be digitised as, say, 136.4, it will in fact be digitised as 136 because the ADC can only produce integers. Thus, in this example, an error of -0.4 has been introduced just by digitisation.
We are interested to measure the random noise level rather than the fixed imperfections. We can exclude the fixed imperfections by subtracting one image from another because, by definition, the imperfections are the same in the two images. This is why we took two identical shots at each ISO setting.
After one image has been subtracted from the other, the standard deviation of the result is calculated. The noise is then given by this standard deviation divided by the square root of 2 (to adjust for the fact that noise from both images contributes to the figure).
Statistics for the green component for a 200 x 200 pixel area in the centre of the image are shown in the table:
The noise and offset signal are plotted in the graph:
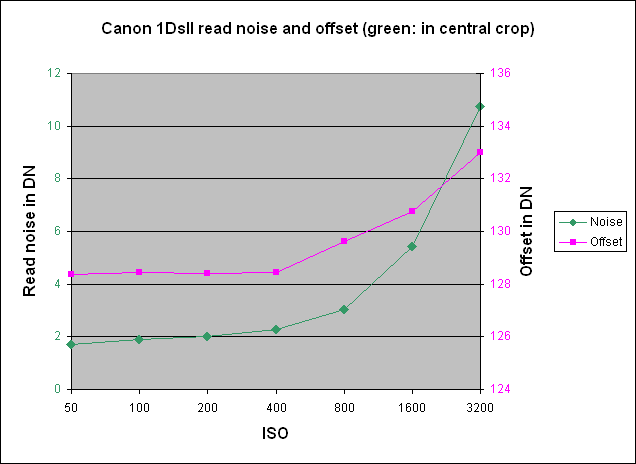
Note that ISOs 50 and 3200 are in the "extended" range of the 1Ds and produced by over or under exposing the true speeds of 100 and 1600 respectively.
Unlike the 5D and D3, the offset signal increases with ISO, but not by much. The offset is flat up to ISO 400 and then starts to rise, making one wonder as to how the higher speeds are produced.
Peter Facey, Winchester, England
20080308 originated